
Bitcoin (BTC) experienced a minor decline last week, dropping the price to a low of $65,117. However, it recorded a strong recovery and, despite significant volatility on Saturday, continued its momentum towards the critical psychological milestone of $70,000.
The BTC rally could be the result of several developments over the weekend, including notable supportive comments from former President Donald Trump regarding the asset during the 2024 Bitcoin conference. Trump also suggested that some of the BTC currently held by the U.S. Department of Justice be allocated to the country’s strategic reserves. Speculation is also rife about possible interest rate cuts in the U.S., which have further boosted the BTC market.
Bitcoin (BTC) Continues in March at $70,000
After a retreat the previous week, Bitcoin (BTC) appears poised to conquer the extremely important $70,000 threshold. According to CryptoQuant CEO Ki Young Ju, BTC’s rapid recovery after its pullback indicates that buyers are purchasing every dip, even small ones. Data has shown that Bitcoin whales are on a buying spree, with long-term holders adding 358,000 BTC to their balances in July. According to the CEO of CryptoQuant, the current trend suggests that BTC is clearly in a phase of accumulation.
“Bitcoin is in an accumulation phase. Last month, 358,000 BTC moved to permanent holder addresses.”
Marathon Digital, the world’s largest Bitcoin mining company, revealed the addition of $100 million worth of BTC to its holdings last month. This brings the company’s total BTC holdings to over 20,000 BTC. According to Marathon Digital CEO and Chairman Fred Thiel, the company now plans to fully adopt a HODL strategy and hold BTC as a strategic reserve asset.
“Today, Marathon is proud to announce that in support of our strategy to keep Bitcoin as our strategic reserve asset, we purchased $100 million in BTC last month and will now be fully HODLing.”
Caution Advised
While most market participants and analysts are incredibly bullish on Bitcoin (BTC) long-term, some have advised caution in the near term. One such individual is Charles Edwards, founder of Capriole Investments. According to Edwards, the launch of spot Ethereum ETFs in a weak market could create selling pressure on BTC if institutional Bitcoin ETF holders plan to diversify their holdings.
Bitcoin (BTC) Price Analysis
Bitcoin (BTC) is on the verge of reclaiming the $70,000 mark, though sellers are expected to significantly defend this level and the resistance at $72,000. BTC’s rapid recovery from the lows within the week shows a positive sentiment around the asset, with investors buying the dip. In the short term, traders expect BTC to surpass $70,000 and set a new all-time high. However, long-term traders and market observers are extremely bullish on the asset. Some, like SkyBridge Capital founder Anthony Scaramucci, have stated that BTC’s market capitalization could potentially surpass that of gold. The current market capitalization of gold is between $15 and $16 trillion, while BTC is approximately $1.3 trillion.
As previously mentioned, BTC experienced a drop last week, pushing the price to $65,142 by the end of Wednesday. Sellers continued to push BTC lower on Thursday, with BTC falling below $65,000 and reaching a low of $63,486. However, with investors buying the dip, BTC managed a strong recovery from this level, eventually increasing by 0.69% to rise above $65,000 and settle at $65,845. BTC continued to rise on Friday, gaining 3.12% to settle at $67,899 and breaking above the resistance at $67,500.
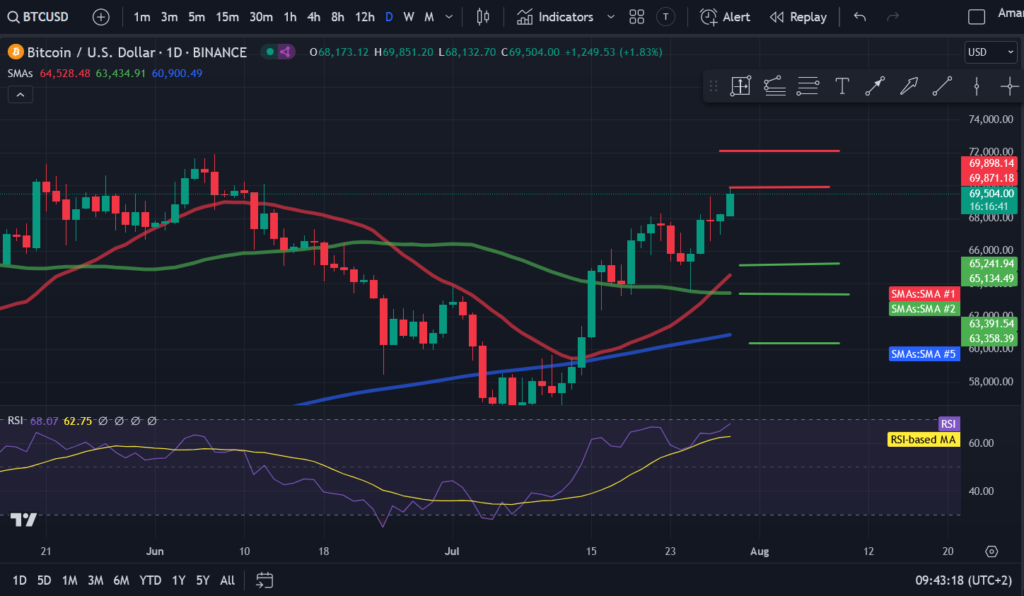
Source: TradingView
The weekend began with BTC facing significant selling pressure on Saturday, as buyers and sellers fought for control of the market. BTC experienced notable fluctuations, reaching a low of $66,610 and a high of $69,332 before eventually settling at $67,833. Bulls took control on Sunday, pushing BTC up by 0.62%, with the price climbing above $68,000 to settle at $68,254. The current session sees BTC trading above $69,500 as BTC bulls attempt to push the price over $70,000. However, as indicated by the wick, BTC is facing selling pressure at higher levels.
The 20-day SMA is currently bullish, and the RSI is also in positive territory, suggesting a strong bullish sentiment. Bulls will attempt to break through $70,000, and if successful, they could push the price to $72,000. However, if sentiment reverses, BTC could see a significant drop that might drive the price to $65,000 or lower.
Ethereum (ETH) Price Analysis
Ethereum (ETH) made a strong recovery over the last 24 hours, marking an increase of nearly 5%. However, it has faced rejections at critical resistance levels such as $3,500 and more recently at the 20-day SMA. ETH recorded significant declines of 4.25% and 4.82% on Wednesday and Thursday, respectively. This drop also led ETH to fall below the 20, 50, and 200-day SMAs. ETH fell to a low of $3,089 on Thursday before buyers managed to push the price up to $3,175. ETH rebounded on Friday as buyers entered the market, increasing by 3.20%. However, it was unable to surpass the 20-day SMA and settled at $3,277.
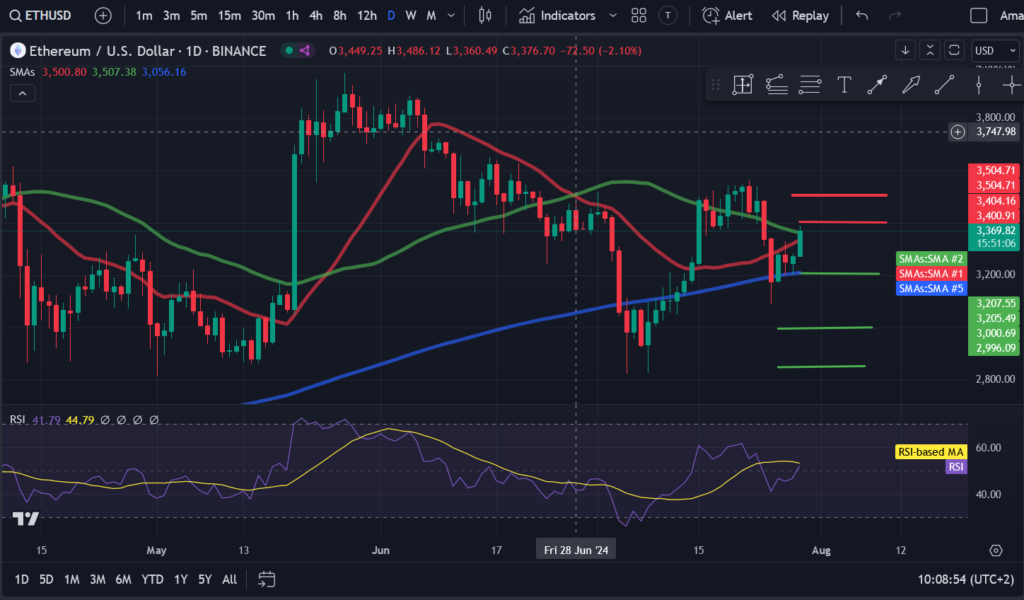
Source: TradingView
The weekend started with a 0.83% drop, seeing ETH fall to $3,250 before buyers managed a marginal increase, allowing ETH to settle at $3,272. During the current session, buyers have taken control, with ETH rising by nearly 3%. Buyers will attempt to push the price above $3,400 and test the resistance at $3,500 again. Let’s look at some indicators to gauge potential price movements. The RSI has moved above its midpoint, suggesting that ETH could see a gradual price appreciation this week. If ETH is able to surpass $3,400, it will aim to test $3,500. A break above this level could open the doors for a potential rise to $3,700. However, if sentiment reverses, we might see the price drop to $3,200.
Solana (SOL) Price Analysis
Solana (SOL) has shown an incredible recovery after falling to a low of $165 last week. Following last week’s drop, SOL exhibited significant strength over the weekend and firmly targeted $200. SOL fell below the $170 support level on Thursday, but strong demand at lower levels allowed buyers to push the price back above $170, with SOL eventually closing at $171.87. Friday saw buyers turning sentiment bullish, with SOL rising 6.56% and moving above $180 to $183.15.
SOL experienced significant volatility on Saturday as bulls tried to surpass $185. Despite strong selling pressures, buyers managed a marginal increase but were unable to break above $185, settling instead at $183.96. SOL eventually moved above $185 on Sunday, as a 0.60% rise allowed it to settle at $185.06. Buyers are also maintaining control during the current session, with SOL increasing by nearly 4% and trading above $190. If SOL can stay and close above $190, it may surpass $200 and look to move above $210. However, bulls need to sustain the momentum for this scenario, especially with sellers expected to defend the $200 level.

Source: TradingView
However, if sentiment changes and SOL falls below $185, it could indicate that demand is drying up at higher levels, with selling pressure dominating. In such a scenario, SOL could drop to $170 or even $160.
Ripple (XRP) Price Analysis
Ripple (XRP) had experienced an incredible increase in mid-July, allowing it to surpass $0.60. However, momentum has slowed since, with XRP trading between $0.55 and $0.65. Bulls made a strong attempt to break above $0.65, with XRP reaching a high of $0.63. However, due to intense selling pressure at higher levels, the price was rejected and eventually settled at $0.61. Sellers took control on Thursday, reducing XRP by nearly 3% before buyers managed to help XRP record a marginal increase that kept the price above $0.60.
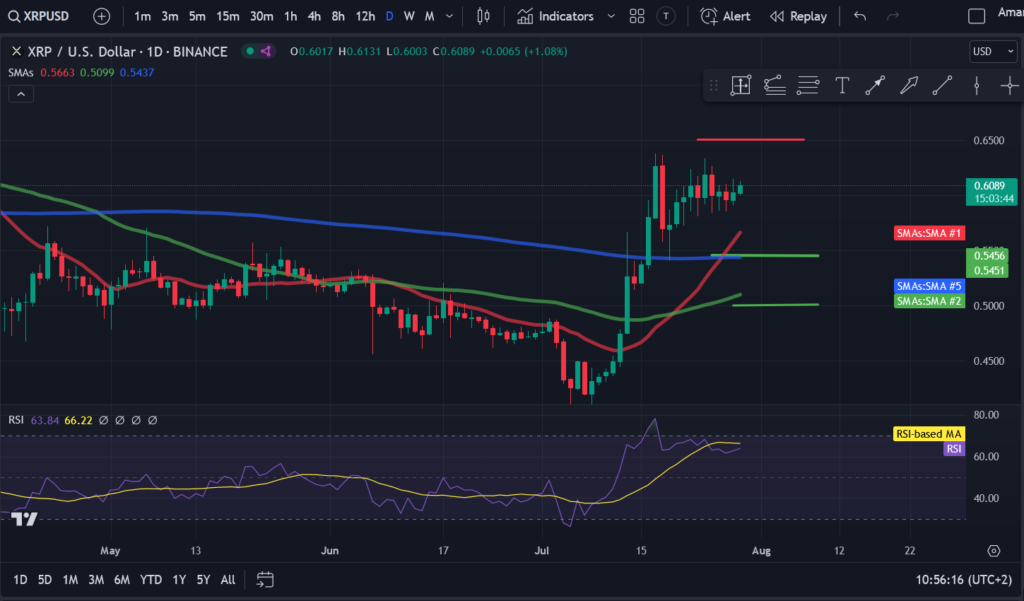
Source: TradingView
XRP had a mixed weekend, experiencing a decline of 1.16% on Saturday, which caused the price to fall below $0.60 to $0.59. However, buyers were able to push back on Sunday, and XRP ended the weekend above $0.60. The current session sees XRP increasing by nearly 1% as bulls attempt to surpass $0.60. With the RSI in positive territory, the bulls have the edge for now. If buyers can push above $0.65, it could open the doors for a move to $0.70 and beyond. However, if the price reverses and falls to the 20-day SMA, it could indicate profit-taking. If this happens, we might see further decline to $0.50.
Cardano (ADA) Price Analysis
Cardano (ADA) spent most of the previous week in the red, facing significant selling pressure after being rejected from $0.45. By Thursday, ADA had fallen below the 20-day and 50-day SMAs and its support level of $0.40, settling at $0.39. Sellers had pushed the price down to a low of $0.38, but with demand increasing at lower levels, ADA managed to halt the decline and recovered with demand rising at lower levels. ADA increased by nearly 6%, pushing back above $0.40 and settling at $0.41. With the 20-day SMA acting as a dynamic resistance level, ADA could not make any gains on Saturday but fell into the red on Sunday as sellers reduced the price by 2.63%. The current session sees ADA increasing by 3.44% as buyers try to overcome the 20-day SMA and aim to move towards $0.45.

Source: TradingView
If ADA is able to achieve such a move, it would indicate that the sentiment is turning positive. A break above $0.45 would set the stage for a move to $0.50. However, a reversal could cause ADA to fall back to its support level of $0.40.
Dogecoin (DOGE) Price Analysis
Dogecoin (DOGE) faced significant downward pressure last week, with sellers driving the price down to a low of $0.120 on Thursday, a critical support level for the asset. DOGE managed to bounce from this level, indicating that buyers are defending it and that there is demand at lower levels. The price eventually settled at $0.124. DOGE saw a notable jump of 7.21% on Friday, rising to $0.133, with buyers attempting to push above $0.140. However, with sellers active at higher levels, DOGE pulled back, eventually settling at $0.131. On Sunday, there was another slight drop that pushed DOGE below $0.130 to $0.129.
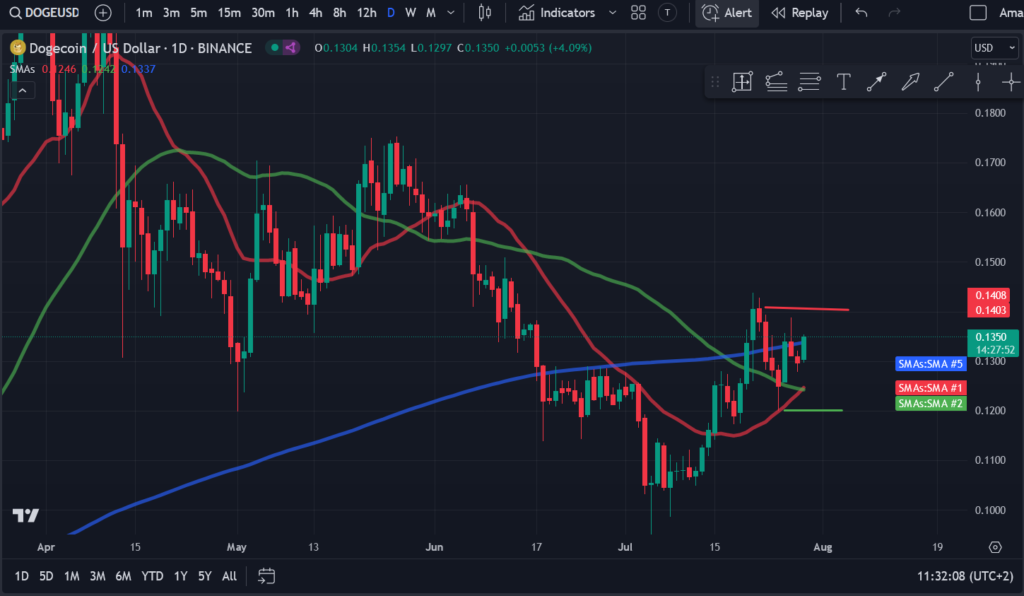
Source: TradingView
The current session sees DOGE rising just over 4% as buyers attempt to move above the 200-day SMA. DOGE needs to push and close above the 200-day SMA for a move toward $0.140 to materialize. A break above this level could open the doors for a move above $0.150. However, if sellers regain control, the price could return to the support level of $0.120.
Polkadot (DOT) Price Analysis
Polkadot (DOT) has struggled since losing the critical $6 level, with the price struggling to gain momentum. As a result of recent struggles, DOT fell more than 6% last week, hitting a low of $5.66 on Wednesday. The price faced significant selling pressure on Thursday, dropping to a low of $5.54. However, the price managed to make a strong recovery from this level, as buyers rejected the losses, allowing DOT to settle at $5.76, a marginal increase. This increase hints at strong demand at lower levels, although demand at higher levels has dried up.

Source: TradingView
DOT was able to rise by 1.91% on Friday but fell into the red over the weekend, recording a decline of 0.51% on Saturday and 2.05% on Sunday to close the weekend at $5.72. The current session sees DOT trading at $5.85, marking a 2.27% increase. So, where is DOT headed from here? So far, DOT has not managed to surpass the $6 level, which is crucial for a potential recovery. However, there is strong support at $5.50, and if demand increases, we could see DOT attempt to move above $6. If it fails to do so, we might see the price fall back to $5.50 and trade between these two levels for now.
Uniswap (UNI) Price Analysis
Uniswap (UNI) has been on a downtrend since June when it reached a high of $12. Since then, the asset has lost almost half of its value, falling to a low of $7.04 last week. In fact, UNI spent most of the previous week in the red, losing a critical support level on Wednesday. However, the price recovered on Friday, increasing by 5.40% to reclaim its support level at $7.50 and settle at $7.67. Buyers attempted to move towards $8 on Saturday, as UNI rose to a high of $7.95, but with the 20-day SMA acting as a dynamic resistance level, sellers managed to push the price back down. UNI eventually settled at $7.69, marking only a marginal increase.
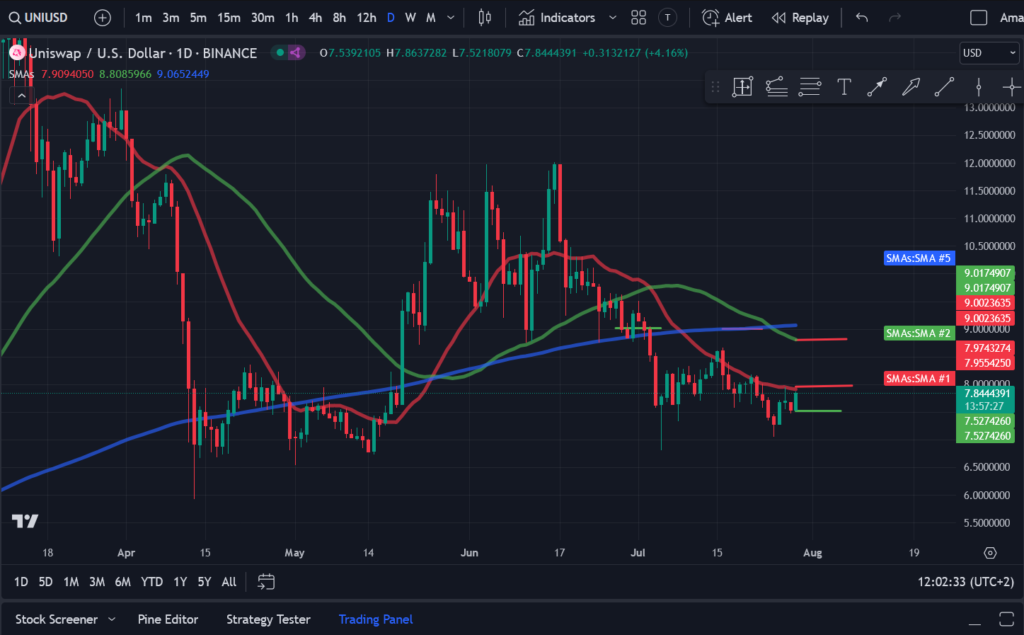
Souce: TradingView
Sellers tried to push UNI below $7.50 on Sunday, but were unsuccessful, with the price settling at $7.53 after a 2% drop. The current session sees UNI rising by just over 4% as buyers attempt to move above $8. A break above $8 could allow UNI to surge to the next resistance level at $8.80.
Disclaimer: This article is provided for informational purposes only. It is not offered or intended to be used as legal, tax, investment, financial, or other advice.

No Comment! Be the first one.