


 breaks out of the bull flag pattern – $100,000 is the next big target")
On Sunday, Bitcoin managed to hold and confirm above its bull flag with an incredible doji candle. On Monday, Bitcoin saw a surge upward, targeting $71,000. The all-time high of $73,800 is expected to follow, before potentially skyrocketing into price discovery, with the next major target being $100,000.
Game Theory
The world is finally waking up to Bitcoin. Presidential candidate Donald Trump wants to make Bitcoin part of the U.S. strategic reserves, China is trying to ban it, and at least one sovereign state might be secretly buying it.
Could a full-scale game theory scenario be starting? It would only take one of the superpowers, or even just one large country, to start buying Bitcoin, and that could trigger a massive land grab to acquire whatever is left of this rapidly diminishing asset.
For entities like the U.S. or China, printing a whole load of paper and buying the hardest asset on the planet would be the simplest thing. Just as with gold, becoming the largest holder of Bitcoin in the world will be crucial as the melting of fiat currencies begins to worsen and the race toward insolvency accelerates.
Bull Flag Breakouts


Source: TradingView
On the weekly timeframe, the Bitcoin bull flag is a thing of beauty. With three perfect contact points at the bottom of the flag and several at the top, there is no doubt it has formed a classic flag pattern.
Last week’s candle was key to this breakout. After reaching the top of the flag with a massive push upward from the bottom over a period of two to three weeks, a correction back to the flag nearly touched the major support at $63,000. This was the last action within the flag, as this correction was largely bought up by the bulls.
The week closed with a doji candle with a long tail that held support just above the top of the bull flag. Now, on Monday, $BTC aims to strengthen and surpass its all-time high before heading to its next destination.
Looking at the bottom of the chart, one can see the stochastic RSI. This is an incredibly strong momentum indicator, signaling that strong momentum is currently pushing the price higher.
Bitcoin’s Stars Align
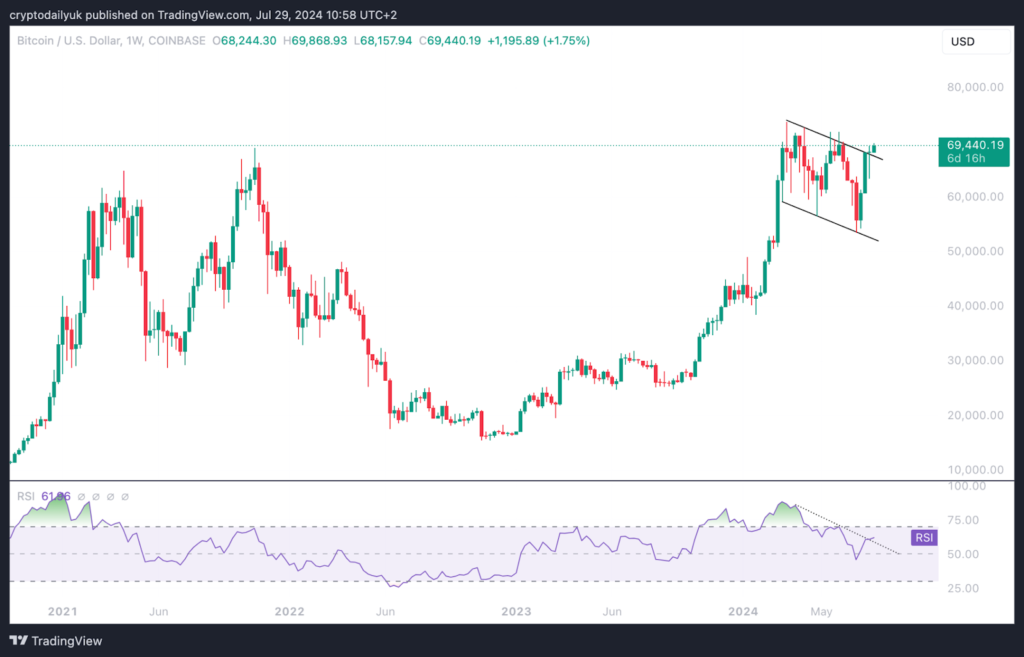
Source: TradingView
Zooming out, one can see that the price is now pushing above the high of the last bullish market in 2021. Once confirmed above this level, it will be truly bullish for Bitcoin.
Looking at the bottom of this chart, the RSI, which indicates overbought or oversold conditions, appears to be breaking the downtrend that started in early March of this year. If this breakout is confirmed by the end of the week and the RSI can reach above the 70 level, a new bullish trend will be confirmed.
The stars are truly aligning for Bitcoin. Who would have imagined, right at the start of this bullish market, that a U.S. Bitcoin ETF would be approved and that the world’s largest asset management company, BlackRock, would amass such a huge amount of $BTC in such a short period?
Who would have thought that the largest governments in the world would start becoming increasingly favorable towards this asset? Bitcoin’s time has arrived, and bullish price targets are likely to become more difficult to predict.
Disclaimer: This article is for informational purposes only. It is not offered and should not be used as legal, tax, investment, financial, or other advice.